Despite the progressive development of medical diagnostic methods, electrocardiography is the most in demand. This procedure allows you to quickly and accurately determine cardiac dysfunction and their cause. The examination is accessible, painless and non-invasive. The results are decoded immediately, the cardiologist can reliably determine the disease and promptly prescribe the correct therapy.
ECG method and symbols on the graph
Due to the contraction and relaxation of the heart muscle, electrical impulses are generated. This creates an electric field that covers the entire body (including legs and arms). During its work, the heart muscle generates electrical potentials with positive and negative poles. The potential difference between the two electrodes of the cardiac electric field is recorded in the leads.
Thus, ECG leads are a diagram of the location of conjugate points of the body that have different potentials. The electrocardiograph records signals received over a certain time period and converts them into a visual graph on paper. The time range is recorded on the horizontal line of the graph, and the depth and frequency of transformation (change) of pulses is recorded on the vertical line.
The direction of the current to the active electrode fixes a positive wave, and the removal of the current fixes a negative wave. In the graphic image, the teeth are represented by sharp angles located at the top (plus tooth) and below (minus tooth). Too high teeth indicate pathology in one or another part of the heart.
Designations and indicators of teeth:
- The T-wave is an indicator of the recovery stage muscle tissue ventricles of the heart between contractions of the middle muscular layer of the heart (myocardium);
- the P wave displays the level of depolarization (excitation) of the atria;
- Q, R, S - these teeth show agitation of the cardiac ventricles (excited state);
- The U wave reflects the recovery cycle of remote areas of the ventricles of the heart.
The range gap between teeth located adjacent to each other constitutes a segment (segments are designated as ST, QRST, TP). The connection of a segment and a tooth is the interval of passage of the impulse.
More about leads
For accurate diagnosis, the difference in indicators of the electrodes (electrical potential of the lead) attached to the patient’s body is recorded. In modern cardiological practice, 12 leads are accepted:
- standard – three leads;
- reinforced - three;
- chest – six.
Diagnostics are carried out only by specialists who have received the appropriate qualifications
Standard or bipolar leads are fixed by the potential difference emanating from electrodes fixed in the following areas of the patient’s body:
- left hand – electrode “+”, right – minus (first lead - I);
- left leg– sensor “+”, right hand – minus (second lead - II);
- left leg – plus, left arm – minus (third lead - III).
Electrodes for standard leads are secured with clips in the lower part of the limbs. The conductor between the skin and the sensors is wipes treated with saline solution or medical gel. A separate auxiliary electrode installed on the right leg performs the grounding function. Reinforced or unipolar leads, according to the method of fixation on the body, are identical to standard ones.
The electrode, which registers changes in the potential difference between the limbs and the electrical zero, has a “V” designation in the diagram. The left and right arms are designated “L” and “R” (from English “left”, “right”), the leg corresponds to the letter “F” (leg). Thus, the place of attachment of the electrode to the body in the graphic image is determined as aVL, aVR, aVF. They record the potential of the limbs on which they are attached.
Reinforced electrodes are necessary for convenient decoding of the cardiogram, since without them the waves on the graph will be weakly expressed.
Bipolar standard and unipolar reinforced leads determine the formation of a coordinate system of 6 axes. The angle between the standard leads is 60 degrees, and between the standard and the adjacent enhanced lead is 30 degrees. The cardiac electrical center splits the axes in half. The negative axis is directed towards the negative electrode, the positive axis, respectively, is directed towards the positive electrode.
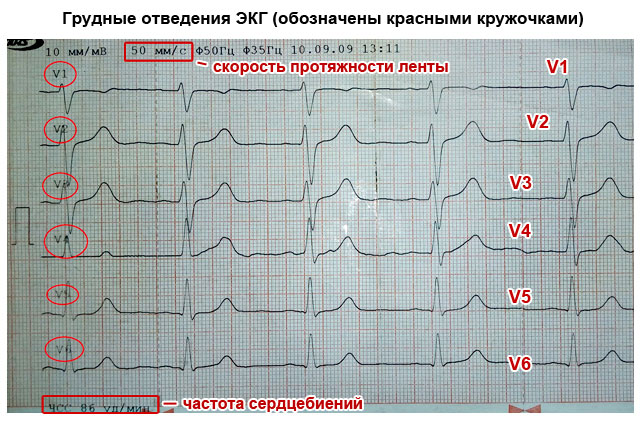
ECG chest leads are recorded by single-pole sensors attached to the skin of the chest using six suction cups connected by tape. They record impulses from the circumference of the cardiac field, which is equally potential to the electrodes on the limbs. On a paper chart, the chest leads are designated “V” with a serial number.
Cardiac examination is performed according to a specific algorithm, therefore the standard system for installing electrodes in the chest area cannot be changed:
- in the area of the fourth anatomical space between the ribs on the right side of the sternum - V1. In the same segment, only on the left side - V2;
- connection of the line coming from the middle of the clavicle and the fifth intercostal space - V4;
- lead V3 is located at the same distance from V2 and V4;
- connection of the anterior axillary line on the left and the fifth intercostal space - V5;
- intersection of the left middle part of the axillary line and the sixth space between the ribs - V6.

Additional electrodes are used when it is difficult to make a diagnosis, when decoding the six main indicators does not provide an objective picture of the disease
Each lead on the chest is connected by an axis to the electrical center of the heart. In this case, the position angle V1–V5 and the angle V2–V6 are equal to 90 degrees. The clinical picture of the heart can be recorded by a cardiograph using 9 branches. Three unipolar leads are added to the usual six:
- V7 – at the junction of the 5th intercostal space and the posterior line of the armpit;
- V8 – the same intercostal area, but in the midline of the armpit;
- V9 is the paravertebral zone, parallel to V7 and V8 horizontally.
Sections of the heart and the leads responsible for them
Each of the six main leads displays one or another part of the heart muscle:
- I and II standard leads are the anterior and posterior cardiac walls, respectively. Their totality reflects standard lead III.
- aVR – lateral cardiac wall on the right;
- aVL – lateral cardiac wall anterior to the left;
- aVF – posterior inferior wall of the heart;
- V1 and V2 – right ventricle;
- VZ – septum between the two ventricles;
- V4 – upper cardiac section;
- V5 – lateral wall of the left ventricle in front;
- V6 – left ventricle.
Thus, deciphering the electrocardiogram is simplified. Failures in each individual branch characterize the pathology of a specific area of the heart.
ECG by Sky
In the Sky ECG technique, it is common to use only three electrodes. Red and yellow sensors are fixed in the fifth intercostal space. Red on the right side of the chest, yellow on the back of the axillary line. The green electrode is located on the line of the middle of the collarbone. Most often, an electrocardiogram according to the Sky is used to diagnose necrosis of the posterior heart wall (posterior basal myocardial infarction), and to monitor the condition of the heart muscles in professional athletes.

Schematic arrangement of the ventricles and atria, based on the location of which the electrodes are placed
Standard indicators of the main ECG parameters
The following arrangement of teeth in the leads is considered normal ECG indicators:
- equal distance between R-teeth;
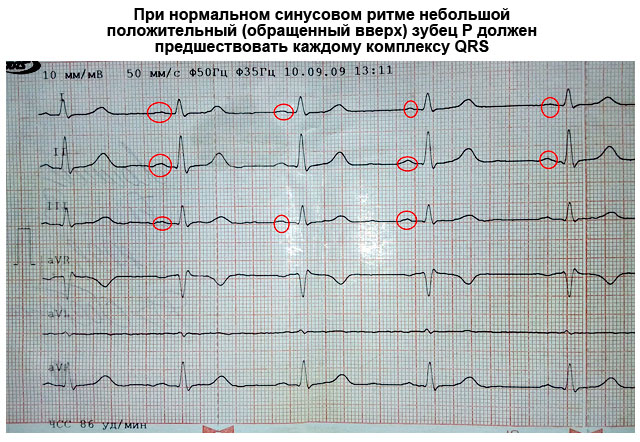
- the P wave is always positive (it may be absent in leads III, V1, aVL);
- the horizontal interval between the P-wave and the Q-wave is no more than 0.2 seconds;
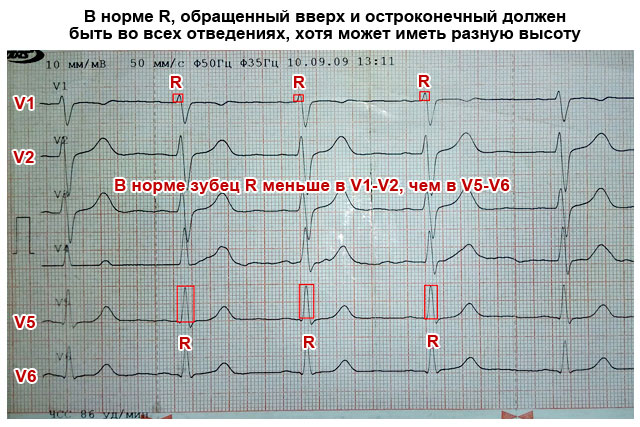
- S and R waves are present in all leads;
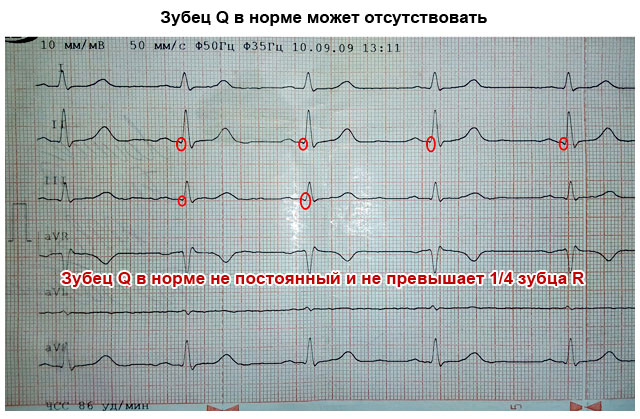
- The Q wave is exclusively negative;
- The T wave is positive, always shown after the QRS.
ECG is taken on an outpatient basis, in a hospital setting, and at home. The results are decoded by a cardiologist or therapist. If the obtained indicators do not correspond to the established norm, the patient is hospitalized or prescribed medication.
From this article you will learn about such a diagnostic method as an ECG of the heart - what it is and what it shows. How an electrocardiogram is recorded, and who can most accurately decipher it. You will also learn how to independently determine the signs of a normal ECG and major heart diseases that can be diagnosed using this method.
Article publication date: 03/02/2017
Article updated date: 05/29/2019
What is an ECG (electrocardiogram)? This is one of the simplest, most accessible and informative methods for diagnosing heart disease. It is based on recording electrical impulses arising in the heart and graphically recording them in the form of teeth on a special paper film.
Based on these data, one can judge not only the electrical activity of the heart, but also the structure of the myocardium. This means that using an ECG you can diagnose many various diseases hearts. Therefore, independent interpretation of the ECG by a person who does not have special medical knowledge is impossible.
All that an ordinary person can do is only roughly assess the individual parameters of the electrocardiogram, whether they correspond to the norm and what pathology they may indicate. But final conclusions based on the ECG conclusion can only be made by a qualified specialist - a cardiologist, as well as a therapist or family doctor.
Principle of the method
The contractile activity and functioning of the heart is possible due to the fact that spontaneous electrical impulses (discharges) regularly occur in it. Normally, their source is located in the uppermost part of the organ (in the sinus node, located near the right atrium). The purpose of each impulse is to travel along the nerve pathways through all parts of the myocardium, causing them to contract. When an impulse arises and passes through the myocardium of the atria and then the ventricles, their alternating contraction occurs - systole. During the period when there are no impulses, the heart relaxes - diastole.
ECG diagnostics (electrocardiography) is based on recording electrical impulses arising in the heart. For this purpose, a special device is used - an electrocardiograph. The principle of its operation is to capture on the surface of the body the difference in bioelectric potentials (discharges) that occur in different parts of the heart at the moment of contraction (in systole) and relaxation (in diastole). All these processes are recorded on special heat-sensitive paper in the form of a graph consisting of pointed or hemispherical teeth and horizontal lines in the form of spaces between them.

What else is important to know about electrocardiography
Electrical discharges of the heart pass not only through this organ. Since the body has good electrical conductivity, the strength of the exciting cardiac impulses is sufficient to pass through all tissues of the body. They spread best to the chest in the area, as well as to the upper and lower extremities. This feature is the basis of the ECG and explains what it is.
In order to record the electrical activity of the heart, it is necessary to fix one electrocardiograph electrode on the arms and legs, as well as on the anterolateral surface of the left half of the chest. This allows you to capture all directions of electrical impulses propagating throughout the body. The paths of discharges between the areas of contraction and relaxation of the myocardium are called cardiac leads and are designated on the cardiogram as follows:
- Standard leads:
- I – first;
- II – second;
- Ш – third;
- AVL (analogue of the first);
- AVF (analogue of the third);
- AVR (mirroring all leads).

The significance of the leads is that each of them registers the passage of an electrical impulse through a certain area of the heart. Thanks to this, you can obtain information about:
- How is the heart located in chest(electrical axis of the heart, which coincides with the anatomical axis).
- What is the structure, thickness and nature of blood circulation of the myocardium of the atria and ventricles.
- How regularly do impulses occur in the sinus node and are there any interruptions?
- Are all impulses carried out along the paths of the conducting system, and are there any obstacles in their path?
What does an electrocardiogram consist of?
If the heart had the same structure of all its departments, nerve impulses would pass through them in the same time. As a result, on the ECG, each electrical discharge would correspond to only one tooth, which reflects the contraction. The period between contractions (impulses) on the EGC looks like an even horizontal line, which is called an isoline.
The human heart consists of right and left halves, in which the upper part is the atria, and the lower part is the ventricles. Since they have different sizes, thicknesses and are separated by partitions, the exciting impulse passes through them at different speeds. Therefore, different waves corresponding to a specific part of the heart are recorded on the ECG.

What do the teeth mean?
The sequence of propagation of systolic excitation of the heart is as follows:
- The origin of electric pulse discharges occurs in the sinus node. Since it is located close to the right atrium, it is this section that contracts first. With a slight delay, almost simultaneously, the left atrium contracts. On the ECG, such a moment is reflected by the P wave, which is why it is called atrial. It faces up.
- From the atria, the discharge passes to the ventricles through the atrioventricular (atrioventricular) node (a collection of modified myocardial nerve cells). They have good electrical conductivity, so delays in the node do not normally occur. This is displayed on the ECG as the P-Q interval - a horizontal line between the corresponding teeth.
- Excitation of the ventricles. This part of the heart has the thickest myocardium, so the electrical wave travels through them longer than through the atria. As a result, the highest wave appears on the ECG - R (ventricular), facing upward. It may be preceded by a small Q wave, the apex of which faces in the opposite direction.
- After the completion of ventricular systole, the myocardium begins to relax and restore energy potentials. On the ECG it looks like an S wave (facing down) - a complete lack of excitability. After it comes a small T wave, facing upward, preceded by a short horizontal line - the S-T segment. They indicate that the myocardium has fully recovered and is ready to make another contraction.

Since each electrode attached to the limbs and chest (lead) corresponds to a specific part of the heart, the same teeth look different in different leads - they are more pronounced in some, and less in others.
How to decipher a cardiogram
Sequential ECG interpretation in both adults and children involves measuring the size, length of the waves and intervals, assessing their shape and direction. Your actions with decryption should be as follows:
- Unfold the paper with the recorded ECG. It can be either narrow (about 10 cm) or wide (about 20 cm). You will see several jagged lines running horizontally, parallel to each other. After a short interval in which there are no teeth, after the recording is interrupted (1–2 cm), the line with several complexes of teeth begins again. Each such graph displays a lead, so it is preceded by a designation of which lead it is (for example, I, II, III, AVL, V1, etc.).
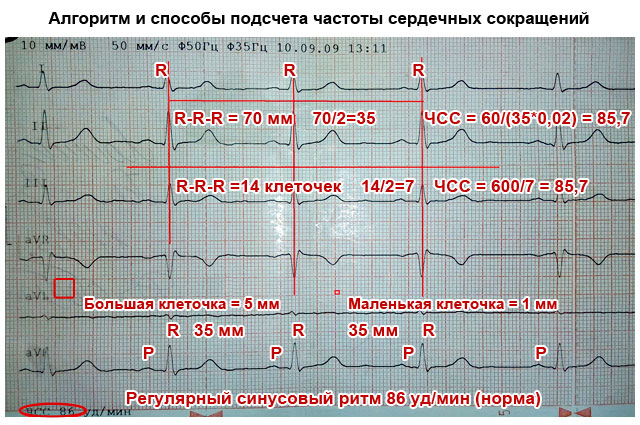
- In one of the standard leads (I, II or III) in which the R wave is the highest (usually the second), measure the distance between three successive R waves (R-R-R interval) and determine the average value (divide number of millimeters per 2). This is necessary to calculate the heart rate per minute. Remember that these and other measurements can be made with a millimeter ruler or by calculating the distance using an ECG tape. Each large cell on the paper corresponds to 5 mm, and each dot or small cell inside it corresponds to 1 mm.
- Assess the spaces between the R waves: are they the same or different? This is necessary in order to determine the regularity of the heart rhythm.
- Sequentially evaluate and measure each wave and interval on the ECG. Determine their suitability normal indicators(table below).
Important to remember! Always pay attention to the speed of the tape - 25 or 50 mm per second. This is fundamentally important for calculating heart rate (HR). Modern devices indicate heart rate on a tape, and there is no need to count.
How to count your heart rate
There are several ways to count the number of heartbeats per minute:
- Typically, the ECG is recorded at a speed of 50 mm/sec. In this case, you can calculate your heart rate (heart rate) using the following formulas:
Heart rate=60/((R-R (in mm)*0.02))
When recording an ECG at a speed of 25 mm/sec:
Heart rate=60/((R-R (in mm)*0.04)
- You can also calculate the heart rate on a cardiogram using the following formulas:
- When recording at 50 mm/sec: HR = 600/average number of large cells between R waves.
- When recording at 25 mm/sec: HR = 300/average of the number of large cells between the R waves.
What does an ECG look like normally and with pathology?
What a normal ECG and wave complexes should look like, what deviations occur most often and what they indicate are described in the table.
Important to remember!
- One small cell (1 mm) on the ECG film corresponds to 0.02 seconds when recording at 50 mm/sec and 0.04 seconds when recording at 25 mm/sec (for example, 5 cells - 5 mm - one large cell corresponds to 1 second).
- The AVR lead is not used for evaluation. Normally, it is a mirror image of standard leads.
- The first lead (I) duplicates the AVL, and the third (III) duplicates the AVF, so they look almost identical on the ECG.

| ECG parameters | Normal indicators | How to decipher deviations from the norm on a cardiogram, and what they indicate |
|---|---|---|
| Distance R–R–R | All spaces between R waves are equal | Different intervals may indicate atrial fibrillation, heart block |
| Heart rate | In the range from 60 to 90 beats/min | Tachycardia – when heart rate is more than 90/min Bradycardia – less than 60/min |
| P wave (atrial contraction) | Facing upward like an arc, about 2 mm high, precedes each R wave. May be absent in III, V1 and AVL | High (more than 3 mm), wide (more than 5 mm), in the form of two halves (double-humped) - thickening of the atrial myocardium |
| Generally absent in leads I, II, FVF, V2 – V6 – the rhythm does not come from the sinus node | ||
| Several small sawtooth-shaped teeth between the R waves – atrial fibrillation | ||
| P–Q interval | Horizontal line between P and Q waves 0.1–0.2 seconds | If it is elongated (more than 1 cm when recording 50 mm/sec) – hearts |
| Shortening (less than 3 mm) – | ||
| QRS complex | Duration is about 0.1 sec (5 mm), after each complex there is a T wave and there is a horizontal line gap | Expansion of the ventricular complex indicates hypertrophy of the ventricular myocardium, bundle branch block |
| If there are no gaps between high complexes facing upward (they go continuously), this indicates either ventricular fibrillation | ||
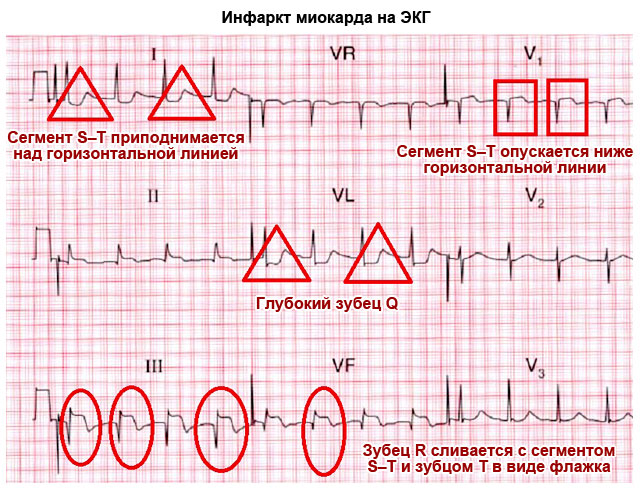
| Looks like a “flag” – myocardial infarction | ||
| Q wave | Downward facing, less than ¼ R deep, may be absent | A deep and wide Q wave in standard or precordial leads indicates acute or previous myocardial infarction |
| R wave | The highest, facing upward (about 10–15 mm), pointed, present in all leads | It may have different heights in different leads, but if it is more than 15–20 mm in leads I, AVL, V5, V6, this may indicate. A jagged R at the top in the shape of the letter M indicates a bundle branch block. |
| S wave | Present in all leads, facing down, pointed, can have different depths: 2–5 mm in standard leads | Normally, in the chest leads its depth can be as many millimeters as the height R, but should not exceed 20 mm, and in leads V2–V4 the depth of S is the same as the height of R. Deep or jagged S in III, AVF, V1, V2 – left ventricular hypertrophy. |
| Segment S–T | Corresponds to the horizontal line between the S and T waves | Deviation of the electrocardiographic line up or down from the horizontal plane by more than 2 mm indicates ischemic disease, angina pectoris or myocardial infarction |
| T wave | Facing upwards in the form of an arc with a height of less than ½ R, in V1 it can have the same height, but should not be higher | A tall, pointed, double-humped T in the standard and chest leads indicates coronary disease and heart overload |
| The T wave merging with the S–T interval and the R wave in the form of an arched “flag” indicates acute period heart attack |

Something else important
The ECG characteristics described in the table in normal and pathological conditions are only a simplified version of the decoding. A full assessment of the results and the correct conclusion can only be made by a specialist (cardiologist) who knows the extended scheme and all the intricacies of the method. This is especially true when you need to decipher an ECG in children. General principles and the elements of the cardiogram are the same as in adults. But there are different standards for children of different ages. Therefore, only pediatric cardiologists can make a professional assessment in controversial and doubtful cases.
Electrocardiography (ECG) is a transthoracic (performed through the chest) study of the electrical activity of the heart over a period of time, performed using electrodes placed on the surface of the skin and recorded using an external device. The record obtained during this procedure is called electrocardiogram(also called ECG). An electrocardiogram is a recording of the electrical activity of the heart.
An ECG is used to evaluate the rhythm and regularity of the heart, measure the size and location of its chambers, determine if there is any damage to the heart, and evaluate the effectiveness of drugs and devices that regulate heart function, such as pacemakers.
Most often, ECGs are used to diagnose and study the human heart, but can also be performed on animals, most often for diagnostic or research purposes.
Purpose
An ECG is the best method for examining and diagnosing cardiac arrhythmias, especially abnormal rhythms caused by damage to the heart's conduction system or electrolyte abnormalities. During myocardial infarction (MI), the ECG can show which wall of the heart is affected, although not all areas of the heart are visible. Using an ECG, it is impossible to reliably assess the pumping function of the heart; echo-CG (ultrasound examination of the heart) or radiological studies are used for this purpose. In some situations, a person with heart failure may still have a normal ECG (a condition known as pulseless disease).
An ECG device records and amplifies the subtle changes in electrical potential on the skin that occur as the heart muscle depolarizes with each heartbeat. During relaxation, each cardiac muscle cell has a negative charge on its cell membrane, called membrane potential. Changing this negative charge to zero by the entry of positively charged Na and Ca ions is called depolarization, this process activates a mechanism that causes the cell to contract. During each heartbeat, a wave of depolarization is generated in a healthy heart, which originates in the trigger cells of the sinoatrial node (SA), then spreads to the atria, passes through the atrioventricular node (AV junction), and finally enters the ventricles.
These processes are detected as tiny rises and falls in voltage between two electrodes placed on each side of the heart and are displayed as a wavy line on the screen and ECG tape. The display shows the general state of the heart rhythm and disturbances in the myocardium in its different parts.
As a rule, more than two electrodes are used; they can be grouped into several pairs. For example: the electrodes on the left arm (LR), right arm (AR) and left leg (LN) form three pairs - LR+PR, LR+LN and LR+LN. The output signal from each pair is called lead. Each lead shows heart activity from a different viewing angle. Different types of ECGs differ in the number of leads they record, such as a 3-lead, 5-lead, or 12-lead ECG. A 12-lead ECG records 12 different electrical signals recorded almost simultaneously and is used for a one-time ECG recording, usually printed on paper. ECGs in 3 and 5 leads are often recorded in real time and displayed only on a special monitor, for example, during surgery or during transportation by ambulance. Depending on the equipment used, a permanent 3-lead or 5-lead ECG may or may not be recorded.
Story
The etymology of the word goes back to Greek word"electro" as it refers to electrical activity, " cardio" - in Greek means heart, "graph" - to write.
According to some sources, in 1872, in the hospital of St. Bartholomew, Alexander Muirhead used wires placed on a patient's chest to record his heartbeat as part of his doctoral research (in electricity). British physiologist John Burdon Sanderson was able to record and visualize cardiac activity using a Lippmann capillary electrometer. The first to find a systematic approach to the heart from an electrical point of view was August Woller, who worked at St. Mary's in Paddington, London.
His electrocardiograph, based on Lippmann's electrometer, was connected to a projector. The heartbeat was recorded onto a photographic plate, which in turn was attached to a toy train. This made it possible to record a series of heartbeats in real time. However, in 1911 he still did not see widespread application of his work in clinical practice.
The first real breakthrough in the field of electrocardiography was made by William Uythoven from Leiden (Netherlands), who used the string galvanometer he invented in 1901. This device was much more sensitive than the capillary electrometer used by Woller and the alternative string galvanometer invented in 1897 by Clément Ader (a French engineer). Unlike modern self-attaching electrodes, Einthoven's electrodes were immersed in containers of saline solution.
Einthoven introduced the letters P, R, Q, S and T to designate ECG waves and described the ECG signs of a number of cardiac vascular diseases. In 1924 he was awarded the Nobel Prize in Medicine for his discovery.
Although the basic principles have not changed since then, many improvements have been introduced in electrocardiography over the years. For example, ECG recording equipment has evolved from bulky stationary devices to compact electronic systems, often including the ability to computer interpret the electrocardiogram.
Tape for recording ECG of the heart
An ECG is recorded as a graphical curve (or sometimes several curves, each describing one lead), with time represented on the x-axis and voltage on the y-axis. As a rule, an electrocardiograph records on a tape lined into small cells of 1 mm each (red or green), and larger and bold ones - 5 mm.
Most ECG devices can change the recording speed, but the default is 25 mm/s, and each mV is equal to 1 cm on the y-axis. A higher speed is usually used when a more detailed examination of the ECG is necessary. At a recording speed of 25mm/s, one small square on the tape equals 40ms. Five small squares make up one big one, which corresponds to 200ms. Thus, 5 large squares appear on the ECG tape per second. The recording may also contain a calibration signal. A standard 1 mV signal moves the recorder pen 1 cm vertically, which is equal to two large squares on the ECG tape.
Appearance
By default, a 12-lead ECG provides a small portion of the recording for each lead. Three lines divide the tape into 4 sections, the first of which shows the main limb leads (I, III and II), the second shows the enhanced limb leads (aVR, aVF and aVL), and the last two represent the chest leads (V1-V6). This order can be changed, so it is necessary to check which lead is labeled on the tape. Each section records three leads at a time, after which it moves on to the next one. Heart rhythm may change during recording.
Each of these segments records approximately 1-3 heartbeats, depending on the heart rate, which is why heart rate analysis can be difficult. To make this task easier, an additional "rhythm strip" is often printed. As a rule, it is recorded in the second lead (which displays the electrical signal from the atria, the P-wave) and records the heart rate for the entire period of the ECG (usually 5-6 seconds). Some electrocardiographs print an additional segment in the second lead. Fixation of this lead continues throughout the entire process of taking the ECG.
The term "rhythm strip" can also refer to the entire ECG trace displayed on a monitor, which may show only one lead, allowing the physician to detect the development of a life-threatening situation in time.
Leads
The term "lead" in electrocardiography sometimes causes difficulties, due to the fact that it can have two various meanings. In addition to its basic meaning, "lead" also refers to the electrical cable that attaches the electrodes to the ECG device. In this capacity it is used, for example, in the expression "left arm abduction", denoting an electrode (and its wire) that should be installed on the left arm. A standard 12-lead ECG typically uses 10 of these electrodes.
An alternative (or, rather, the main, in the context of electrocardiography) meaning of the word “lead” is the curve of the potential difference between two electrodes, the recording of which is actually produced by the ECG. Each lead has its own specific name. For example, “Lead I” (the first standard lead) shows the potential difference between the electrodes on the right and left arms, and “Lead II” (the second standard) shows the difference between the right arm and leg. “ECG in standard 12 leads” implies exactly this meaning of the term.
Electrode placement
A typical 12-lead ECG uses 10 electrodes. They are self-adhesive soft pads coated with conductive gel with attached wires. Sometimes the gel also functions as an adhesive (attaching the electrode to the skin). Each of them is marked and installed on the patient’s body as follows:
|
Electrode marking |
Electrode installation location |
|
PR (red) |
On the right hand, avoiding areas with a pronounced muscle layer. |
|
LR (yellow) |
The same thing, but on the left hand. |
|
PN (black) |
On the right leg, lateral to the calf muscle. |
|
LN (green) |
The same thing on the left leg. |
|
In the 4th intercostal space (between the 4th and 5th ribs), on the right near the sternum. |
|
|
In the 4th intercostal space (between the 4th and 5th ribs), on the left near the sternum. |
|
|
Between V4 and V2 |
|
|
In the 5th intercostal space (between the 5th and 6th rib) along the midclavicular line. |
|
|
Along the left anterior axillary line, at the same level as V4. |
|
|
Along the left midaxillary line, at the same level as V4. |
Additional electrodes
The classic 12-lead ECG can be extended in several ways to detect areas of infarction in areas not visible in standard leads. For this purpose, for example, lead rV4, similar to V4, but on the right side, as well as additional chest leads located on the back - V7, V8 and V9.
The Lewis lead or S5 (consisting of installing PR and LR electrodes to the right of the sternum in the 2nd and 4th intercostal spaces, respectively, and displayed as standard I) is used to more accurately assess atrial activity and diagnose pathologies such as atrial flutter or wide complex tachycardia.
Limb leads (standard leads)
Leads I, III and II are called limb leads. The electrodes that create these signals are located on the limbs - one on each arm and leg. Limb leads form vertices Einthoven triangle.
- Lead I records the voltage between the electrodes on the left arm (LR) and right arm (RA):
I=LR-PR
- Lead II records the voltage between the electrodes on the left leg (LN) and right arm (AR):
II=LN-PR
- Lead III records the voltage between the electrodes on the left leg (LN) and left arm (LR):
III=LN-LR
Simplified versions of the ECG used for educational purposes (at the high school level) are usually limited to these three leads.
Unipolar and bipolar leads
There are two types of leads: unipolar and bipolar. Bipolar leads have a positive and a negative pole. The limb leads for a 12-lead ECG are bipolar. Unipolar leads also have two poles, but the negatively charged pole is a composite one (central Wilson terminal), consisting of a combination of signals from other electrodes. All leads, except the limb leads, are unipolar when recording an ECG in 12 leads: aVR, aVF, aVL, V1, V3, V2, V4, V6, V5.
The central Wilson terminal Vw is formed by connecting the electrodes PR, LN and LR through resistance, the total potential of this electrode approaches zero.
Vw=1/3(PR+LR+LN)
Reinforced limb leads
Leads aVR, aVF and aVL are called reinforced leads from the limbs(also known as Goldberger leads, after the name of their inventor Dr. E. Goldberger). They are derivatives of the same electrodes as leads I, II, III. However, they image the heart from different angles (vectors), since the negative electrode for these leads is represented by the null electrode (central Wilson terminal). The charge on the negative electrode is reset to zero, making the positively charged electrode the “working electrode.” This is explained by Einthoven's rule, which states that I + (−II) + III = 0. This equality can also be written as I + III = II. The second notation is preferable because Einthoven reversed the polarity of lead II in his triangle, perhaps because he preferred to view the QRS complexes in a vertical position. The central Wilson terminal made it possible to create amplified limb leads aVR, aVF and aVL and precordial leads V1, V3, V2, V4, V6 and V5.
- LeadaVR recorded using a positive electrode on the left hand; the negative is represented by a combination of electrodes of the left leg and left hand, which “amplify” the signal from the positively charged electrode of the right hand.
aVR=PR-1/2(LR+LN)
- LeadaVL recorded using a positive electrode on the left hand; the negative is represented by a combination of left leg and right arm electrodes, which “amplify” the signal from the positively charged left arm electrode.
aVL=LR-1/2(PR+LN)
- LeadaVF recorded using a positive electrode on the left leg; the negative is represented by a combination of right/left hand electrodes, which “amplify” the signal from the positively charged electrode of the left foot.
aVF=LN-1/2(PR+LR)
The amplified limb leads aVR, aVF, and aVL propagate in this way because their signals are too small to be useful when the negative electrode is represented by the central Wilson terminal. Together with leads I, II and III, the enhanced leads aVR, aVF and aVL form the basis six-axis system leads according to Bailey, which is used to calculate the electrical axis of the heart in the frontal plane.
Leads aVR, aVF and aVL can also be represented through leads I and II:
aVR=-(I+II)/2
aVL=I-II/2
aVF=II-I/2
Chest leads
The chest lead electrodes - V1, V3, V2, V5, V4 and V6 - are placed directly on the chest. Due to their close proximity to the heart, these electrodes do not require amplification. The negatively charged electrode uses a central Wilson terminal and these leads are unipolar. The chest leads display the electrical activity of the heart in the so-called horizontal plane. The electrical axis of the heart in the horizontal plane is known as the Z-axis.
Teeth and intervals
A typical heartbeat waveform recorded on an ECG consists of a QRS, P wave, T wave, and U wave (the latter observed in 50-75% of cases). The basic voltage of the cardiogram is called isoelectric line(isoline). As a rule, the isoline is determined in the ECG recording area between the end of the T wave and the beginning of the next P wave.
|
Element |
Description |
Duration |
|
R-R interval |
The interval between successive R waves. The normal heart rate determined by this interval is 60-100 beats/min. | |
|
During normal atrial depolarization, the main electrical vector is directed from the SA to the AV junction, and extends from the right atrium to the left. This process is represented on the ECG as a P wave. | ||
|
P-R interval |
Measured from the beginning of the P wave to the beginning of the QRS. This interval represents the time it takes for an electrical impulse to travel from the sinus node through the AV junction to the ventricles. Thus, the PR interval evaluates the function of the AV connection. | |
|
PR segment |
The PR segment connects the P wave to the QRS complex. The impulse is sent from the AV junction to the His bundle and then propagates along the Purkinje fibers. This section exclusively shows the conduction of the impulse; contraction does not occur, so this segment lies on the isoline. The PR interval is clinically more informative. | |
|
QRS complex |
The QRS complex reflects the rapid depolarization of the right and left ventricles. The muscle layer of the ventricles is much more massive than in the atria, so the amplitude of the QRS complex is usually much greater than the P wave. | |
|
The point where the QRS complex ends and the ST segment begins. Used to assess ST segment elevation/depression. | ||
|
ST segment |
The ST segment connects the QRS complex to the T wave. It shows the period of ventricular depolarization. The ST segment normally lies on the isoline. | |
|
Displays ventricular repolarization. The interval between the end of the QRS and the apex of the T wave is called absolute refractory period. The second half of the T wave is designated as relative refractory period. | ||
|
S-T interval |
The S-T interval lasts from the J point to the end of the T wave. | |
|
QT interval |
Lasts from the beginning of the QRS to the end of the T wave. Prolongation of this interval is a factor in the likelihood of developing ventricular tachyarrhythmia and subsequent sudden death. Its duration varies depending on heart rate. |
Up to 420 ms at heart rate 60 beats/min. |
|
It is assumed that the U wave reflects the process of repolarization of the interventricular septum. As a rule, this tooth has a small amplitude, and often is completely absent. This wave always follows the T wave and has the same direction and amplitude as it. Excessive expression of this tooth may indicate hypokalemia, hyperkalemia or hyperthyroidism. |
|
|
|
The J wave, J-spot elevation, or Osborne wave is a delayed delta wave occurring after the QRS complex or as a small additional R wave. It is considered pathognomonic of hypothermia and hypocalcemia. |
|
Initially, 4 waves were identified on the cardiogram, but later, thanks to mathematical correction of distortions produced by early instruments, 5 main waves were discovered. Einthoven designated them with the letters O, P, S, R and T, which correspond to the phenomena he depicted, instead of the faceless and incorrect A, C, B and D.
On the intracardiac electrocardiogram, which can be recorded using special intracardiac sensors, one can see additional waveH, which displays the depolarization of the His bundle. H-V interval represents the segment from the beginning of the H wave to the very first wave of ventricular depolarization recorded in any lead.
Vectors and positions
ECG interpretation is based on the idea that different leads “show” the heart from different angles. This has two advantages. First, the lead in which pathology is recorded (for example, ST segment elevation) helps determine which part of the heart is affected. Secondly, it can be determined general direction depolarization waves, which helps diagnose other cardiac disorders. This direction is also called electrical axis of the heart. The concept of the electrical axis of the heart is based on the concept of the depolarization wave vector. This vector can be described by its components, depending on the direction of the lead in which it is viewed. The total increase in the height of the QRS complex (the height of the R wave minus the depth of the S wave) indicates that the depolarization wave is propagating in the direction coinciding with the lead in which this section of the ECG is taken.
Electrical axis of the heart
The electrical axis of the heart shows the direction in which the depolarization wave propagates ( average electric vector) in the frontal plane. Under the condition of a healthy conduction system of the heart, the electrical axis is directed to where muscle layer the heart (myocardium) is most powerful. Normally, this is the wall of the left ventricle with a slight involvement of the wall of the right ventricle. Typically, this axis is directed from the right shoulder to the left leg, which corresponds to the left lower quadrant in the six-axis lead system, although an angle of inclination in the range of -30° to +90° is considered normal. In the case of an increase in the muscle layer of the left ventricle (myocardial hypertrophy), the axis shifts to the left (“deviation of the EOS to the left side”) and becomes at an angle less than -30°, and vice versa - with hypertrophy of the right ventricle, the axis rotates to the right side (>90°) , there is a “deviation of the EOS to the right.” Disturbances in the conduction system of the heart can provoke deviations in EOS that are not associated with changes in the myocardium.
|
Norm |
from -30° to +90° |
Norm |
Norm |
|
EOS deviation to the left |
May indicate left anterior intraventricular (fascicular) block or inferior wall myocardial infarction with Q wave elevation. |
It is considered normal for pregnant women and patients with emphysema. |
|
|
EOS deviation to the right |
from +90° to +180° |
May indicate left posterior intraventricular (fascicular) block, lateral wall myocardial infarction with Q wave elevation, or right ventricular hypertrophy with ST segment shift. |
Considered normal in children and people with cardiac dextraposition (heart turned to the right) |
|
Sharp deviation of the EOS to the right |
from +180° to -90° |
It is rare and not well studied. |
|
In the case of blockade of the right bundle branch, deviation of the EOS to the right or left may indicate a bifascicular block (attachment of a blockade of any branch of the left bundle branch).
Groups of leads in the clinic
In total, there are 12 standard leads that record the electric field of the heart at different angles, which also corresponds to different areas of the heart in which pathological changes (acute coronary ischemia or infarction) can be monitored. Two leads that record changes in adjacent anatomical areas are called adjacent leads. Clinical significance adjacent leads is to confirm or refute the presence of actual pathology on the ECG.
|
Leads |
Meaning |
|
|
Inferior leads |
I, aVF and II |
Determine electrical activity on bottom wall heart (diaphragmatic surface). |
|
Lateral leads (lateral) |
The electrical activity on the lateral wall of the left ventricle is determined.
|
|
|
Septal leads |
Electrical activity in the area of the interventricular septum is determined. |
|
|
Anterior leads |
The electrical activity in the area of the anterior surface of the heart is determined. |
In addition to the above, leads that follow one another are also considered adjacent. For example, although lead V4 is anterior and V5 is lateral, they are contiguous because they follow each other.
Lead aVR does not have a specific view of the left ventricle. Instead, it shows the inner surface of the right atrium from the right shoulder side.
Filters
Modern ECG monitors use filters to process the incoming signal. The most commonly used modes are monitoring and diagnostics. In monitoring mode, a low-frequency filter (HPF or high-pass filter) is used, which does not pass the range below 0.5-1 Hz, and a high-frequency filter (LPF - low-pass filter), which delays the signal above 40 Hz. These filters reduce distortion when recording heart rate. In diagnostic mode, the high-pass filter is set to 0.05 Hz, which allows accurate recording of ST segments. The low-pass filter is set to 40, 100 or 150 Hz. As a result, the monitoring mode is filtered more strongly than the diagnostic mode, since its bandwidth is narrower.
Indications
The medical community does not recommend ECG as a routine test for patients who do not have cardiac symptoms and who are not at risk for developing coronary disease. The reason is that overuse of this procedure is more likely to lead to a false diagnosis rather than revealing the real problem. False diagnosis of a non-existent disease will lead to an incorrect diagnosis, the prescription of unnecessary treatment with a mass side effects, therefore, the risk associated with it far exceeds the risk of refusing routine ECG testing in persons who do not have indications for it.
Symptoms indicating the need for ECG diagnostics:
- Heart murmurs
- Syncope or collapse (loss of consciousness)
- Seizures
- Heart rhythm disturbance
- Symptoms of heart attack or acute ischemia
ECG is also used in the diagnosis of patients with systemic diseases, and also as monitoring for seriously ill patients and patients under anesthesia.
Some pathologies that can be detected on an ECG
|
Shortening the intervalQT |
Hypercalcemia, taking certain medications, a number of genetic abnormalities, hyperkalemia. |
|
Interval extensionQT |
Hypocalcemia, taking certain medications, a number of genetic abnormalities. |
|
Inversion or flattening of the T wave |
Coronary ischemia, hypokalemia, LV hypertrophy, taking digoxin and some other drugs. |
|
Sharpening the toothT |
Possible early sign acute myocardial infarction, T waves become more pronounced, symmetrical and pointed. |
|
Pointed T waveinterval extensionPR, expansion of the complexQRS, shortening the intervalQT |
Hyperkalemia, calcium chloride, glucose, insulin, hemodialysis. |
|
Pronounced toothU |
Hypokalemia. |
Heterogeneity on the electrocardiogram
The electrocardiogram can reveal heterogeneity (dissimilarity) of areas. Modern research shows that heterogeneity often indicates the possible development of dangerous heart rhythm disturbances.
In the future, to assess the uniformity of ECG intervals, it will be possible to use implantable devices that can not only control the rhythm, but also provide emergency assistance in the form of stimulation if necessary. vagus nerve, injections of beta blockers or, if necessary, cardiac defibrillation.
Fetal ECG
Fetal ECG (fetal ECG) is a recording of the electrical activity of the fetal heart in the womb, carried out during childbirth by installing an electrode on the fetal head through the cervical canal. According to a Cochrane review, the use of fetal ECG monitoring in addition to cardiotocography (CTG) reduces the need for fetal blood testing and additional surgical interventions during labor compared with the use of CTG alone. There were no changes in the number of caesarean sections or differences in the health of newborns.
ECG (electrocardiography, or simply, cardiogram) is the main method for studying cardiac activity. The method is so simple, convenient, and, at the same time, informative that it is used everywhere. In addition, ECG is absolutely safe, and there are no contraindications to it.
Therefore, it is used not only for diagnosing cardiovascular diseases, but also as a prophylaxis during routine medical examinations, before sports competitions. In addition, ECG is recorded to determine suitability for certain professions associated with heavy physical activity.
Our heart contracts under the influence of impulses that pass through the conduction system of the heart. Each pulse represents an electrical current. This current originates at the point where the impulse is generated in the sinus node, and then goes to the atria and ventricles. Under the influence of the impulse, contraction (systole) and relaxation (diastole) of the atria and ventricles occurs.
Moreover, systole and diastole occur in strict sequence - first in the atria (in the right atrium a little earlier), and then in the ventricles. This is the only way to ensure normal hemodynamics (blood circulation) with a complete blood supply to organs and tissues.
Electric currents in the conduction system of the heart create an electric and magnetic field around itself. One of the characteristics of this field is electric potential. With abnormal contractions and inadequate hemodynamics, the magnitude of the potentials will differ from the potentials characteristic of cardiac contractions of a healthy heart. In any case, both normally and in pathology, the electrical potentials are negligibly small.
But tissues have electrical conductivity, and therefore the electric field of a beating heart spreads throughout the body, and potentials can be recorded on the surface of the body. All that is needed for this is a highly sensitive apparatus equipped with sensors or electrodes. If, with the help of this device, called an electrocardiograph, electrical potentials corresponding to the impulses of the conduction system are recorded, then one can judge the functioning of the heart and diagnose disorders of its functioning.
This idea formed the basis of the corresponding concept developed by the Dutch physiologist Einthoven. IN late XIX V. this scientist formulated the basic principles of ECG and created the first cardiograph. In a simplified form, an electrocardiograph consists of electrodes, a galvanometer, an amplification system, lead switches, and a recording device. Electrical potentials are sensed by electrodes that are placed on various parts of the body. The lead is selected using the device switch.
Since the electrical potentials are negligibly small, they are first amplified and then applied to the galvanometer, and from there, in turn, to the recording device. This device is an ink recorder and a paper tape. Already at the beginning of the 20th century. Einthoven was the first to use ECG for diagnostic purposes, for which he was awarded the Nobel Prize.
ECG Triangle of Einthoven
According to Einthoven's theory, the human heart, located in the chest with a shift to the left, is in the center of a kind of triangle. The vertices of this triangle, which is called the Einthoven triangle, are formed by three limbs - the right arm, the left arm, and the left leg. Einthoven proposed recording the potential difference between electrodes placed on the limbs.
The potential difference is determined in three leads, which are called standard leads and are designated by Roman numerals. These leads are the sides of Einthoven's triangle. Moreover, depending on the lead in which the ECG is recorded, the same electrode can be active, positive (+), or negative (-):
- Left hand (+) – right hand (-)
- Right hand (-) – left leg (+)
- Left arm (-) – left leg (+)
Rice. 1. Einthoven's triangle.
A little later, it was proposed to register enhanced unipolar leads from the limbs - the apices of Eythoven's triangle. These enhanced leads are designated by the English abbreviations aV (augmented voltage).
aVL (left) – left hand;
aVR (right) – right hand;
aVF (foot) – left leg.
In enhanced unipolar leads, the potential difference is determined between the limb on which the active electrode is applied and the average potential of the other two limbs.
In the middle of the 20th century. The ECG was supplemented by Wilson, who, in addition to standard and unipolar leads, proposed recording the electrical activity of the heart from unipolar chest leads. These leads are designated by the letter V. For ECG studies, six unipolar leads are used, located on the anterior surface of the chest.
Since cardiac pathology usually affects the left ventricle of the heart, most chest leads V are located in the left half of the chest.

Rice. 2.
V 1 – fourth intercostal space at the right edge of the sternum;
V 2 – fourth intercostal space at the left edge of the sternum;
V 3 – the middle between V 1 and V 2;
V 4 – fifth intercostal space along the midclavicular line;
V 5 – horizontally along the anterior axillary line at the level of V 4;
V 6 – horizontally along the midaxillary line at the level of V 4.
These 12 leads (3 standard + 3 unipolar from the limbs + 6 chest) are mandatory. They are recorded and assessed in all cases of ECG performed for diagnostic or preventive purposes.
In addition, there are a number of additional leads. They are recorded rarely and for certain indications, for example, when it is necessary to clarify the localization of myocardial infarction, to diagnose hypertrophy of the right ventricle, atria, etc. Additional ECG leads include chest leads:
V 7 – at the level of V 4 -V 6 along the posterior axillary line;
V 8 – at the level of V 4 -V 6 along the scapular line;
V 9 – at the level of V 4 -V 6 along the paravertebral (paravertebral) line.
In rare cases, to diagnose changes in the upper parts of the heart, chest electrodes may be placed 1-2 intercostal spaces higher than usual. In this case, they are denoted by V 1, V 2, where the superscript indicates how many intercostal spaces the electrode is located above.
Sometimes, to diagnose changes in the right side of the heart, chest electrodes are applied to the right half of the chest at points that are symmetrical to those with the standard method of recording chest leads in the left half of the chest. In the designation of such leads, the letter R is used, which means right, right - B 3 R, B 4 R.
Cardiologists sometimes resort to bipolar leads, once proposed by the German scientist Neb. The principle of registering leads according to the Sky is approximately the same as registering standard leads I, II, III. But in order to form a triangle, electrodes are placed not on the limbs, but on the chest.
An electrode from the right hand is installed in the second intercostal space at the right edge of the sternum, from the left hand - along the posterior axillary line at the level of the actuator of the heart, and from the left leg - directly to the projection point of the actuator of the heart, corresponding to V 4. Between these points, three leads are recorded, which indicate with Latin letters D, A, I:
D (dorsalis) – posterior lead, corresponds to standard lead I, similar to V 7;
A (anterior) – anterior lead, corresponds to standard lead II, similar to V 5;
I (inferior) – inferior lead, corresponds to standard lead III, similar to V 2.
To diagnose posterobasal forms of infarction, Slopak leads are registered, designated by the letter S. When registering Slopak leads, the electrode placed on the left arm is installed along the left posterior axillary line at the level of the apical impulse, and the electrode from the right arm is moved alternately to four points:
S 1 – at the left edge of the sternum;
S 2 – along the midclavicular line;
S 3 – in the middle between C 2 and C 4;
S 4 – along the anterior axillary line.
In rare cases, to carry out ECG diagnostics resort to precordial mapping, when 35 electrodes in 5 rows of 7 in each are located on the left anterolateral surface of the chest. Sometimes the electrodes are placed in the epigastric region, advanced into the esophagus at a distance of 30-50 cm from the incisors, and even inserted into the cavity of the heart chambers when probing it through large vessels. But all these specific methods of ECG registration are carried out only in specialized centers that have the necessary equipment and qualified doctors.
ECG technique
As planned, ECG recording is carried out in a specialized room equipped with an electrocardiograph. Some modern cardiographs use a thermal printing mechanism instead of a conventional ink recorder, which uses heat to burn the cardiogram curve onto the paper. But in this case, the cardiogram requires special paper or thermal paper. For clarity and convenience of calculating ECG parameters, cardiographs use graph paper.
In the latest modifications of cardiographs, the ECG is displayed on the monitor screen, decrypted using the supplied software, and not only printed on paper, but also saved on digital media (disk, flash drive). Despite all these improvements, the principle of the ECG recording cardiograph has remained virtually unchanged since Einthoven developed it.
Most modern electrocardiographs are multichannel. Unlike traditional single-channel devices, they record not one, but several leads at once. In 3-channel devices, first standard I, II, III are recorded, then enhanced unipolar leads from the limbs aVL, aVR, aVF, and then chest leads - V 1-3 and V 4-6. In 6-channel electrocardiographs, standard and unipolar limb leads are first recorded, and then all chest leads.
The room in which recording is carried out must be removed from sources of electromagnetic fields and X-ray radiation. Therefore, the ECG room should not be placed in close proximity to the X-ray room, rooms where physiotherapeutic procedures are carried out, as well as electric motors, power panels, cables, etc.
There is no special preparation before recording an ECG. It is advisable for the patient to be rested and well-slept. Previous physical and psycho-emotional stress can affect the results and is therefore undesirable. Sometimes food intake can also affect the results. Therefore, an ECG is recorded on an empty stomach, no earlier than 2 hours after a meal.
While recording an ECG, the subject lies on a flat, hard surface (on a couch) in a relaxed state. Places for applying electrodes must be free of clothing.
Therefore, you need to undress to the waist, free your shins and feet from clothes and shoes. Electrodes are applied to the inner surfaces of the lower thirds of the legs and feet (the inner surface of the wrists and ankle joints). These electrodes have the form of plates and are designed for recording standard leads and unipolar leads from the limbs. These same electrodes may look like bracelets or clothespins.
In this case, each limb has its own electrode. To avoid errors and confusion, the electrodes or wires through which they are connected to the device are color coded:
- To the right hand - red;
- To the left hand - yellow;
- To the left leg - green;
- To the right leg - black.
Why do you need a black electrode? After all right leg is not included in the Einthoven triangle, and no readings are taken from it. The black electrode is for grounding. According to basic safety requirements, all electrical equipment, incl. and electrocardiographs must be grounded.
For this purpose, ECG rooms are equipped with a grounding circuit. And if the ECG is recorded in a non-specialized room, for example, at home by ambulance workers, the device is grounded to a central heating radiator or to a water pipe. For this there is a special wire with a fixing clip at the end.
Electrodes for recording chest leads have the shape of a suction cup and are equipped with a white wire. If the device is single-channel, there is only one suction cup, and it is moved to the required points on the chest.
In multi-channel devices there are six of these suction cups, and they are also marked with color:
V 1 – red;
V 2 – yellow;
V 3 – green;
V 4 – brown;
V 5 – black;
V 6 – purple or blue.
It is important that all electrodes adhere tightly to the skin. The skin itself should be clean, free of oil, fat and sweat. Otherwise, the quality of the electrocardiogram may deteriorate. Induction currents, or simply interference, arise between the skin and the electrode. Quite often, the tip occurs in men with thick hair. hairline on the chest and limbs. Therefore, here you need to be especially careful to ensure that the contact between the skin and the electrode is not broken. The interference sharply worsens the quality of the electrocardiogram, which displays small teeth instead of a straight line.

Rice. 3. Induced currents.
Therefore, it is recommended to degrease the area where the electrodes are applied with alcohol and moisten it with a soap solution or conductive gel. For electrodes from the limbs, gauze wipes soaked in saline solution are also suitable. However, it should be borne in mind that the saline solution dries quickly and the contact may be broken.
Before recording, it is necessary to check the calibration of the device. For this purpose, it has a special button - the so-called. reference millivolt. This value reflects the height of the tooth at a potential difference of 1 millivolt (1 mV). In electrocardiography, a reference millivolt value of 1 cm is accepted. This means that with a difference in electrical potentials of 1 mV, the height (or depth) ECG wave equal to 1 cm.

Rice. 4. Each ECG recording must be preceded by a control millivolt test.
Electrocardiograms are recorded at a tape speed of 10 to 100 mm/s. True, extreme values are used very rarely. Basically, the cardiogram is recorded at a speed of 25 or 50 mm/s. Moreover, the last value, 50 mm/s, is standard and most often used. A speed of 25 mm/h is used where the greatest number of heart contractions needs to be recorded. After all, the lower the speed of the tape, the greater the number of heart contractions it displays per unit of time.
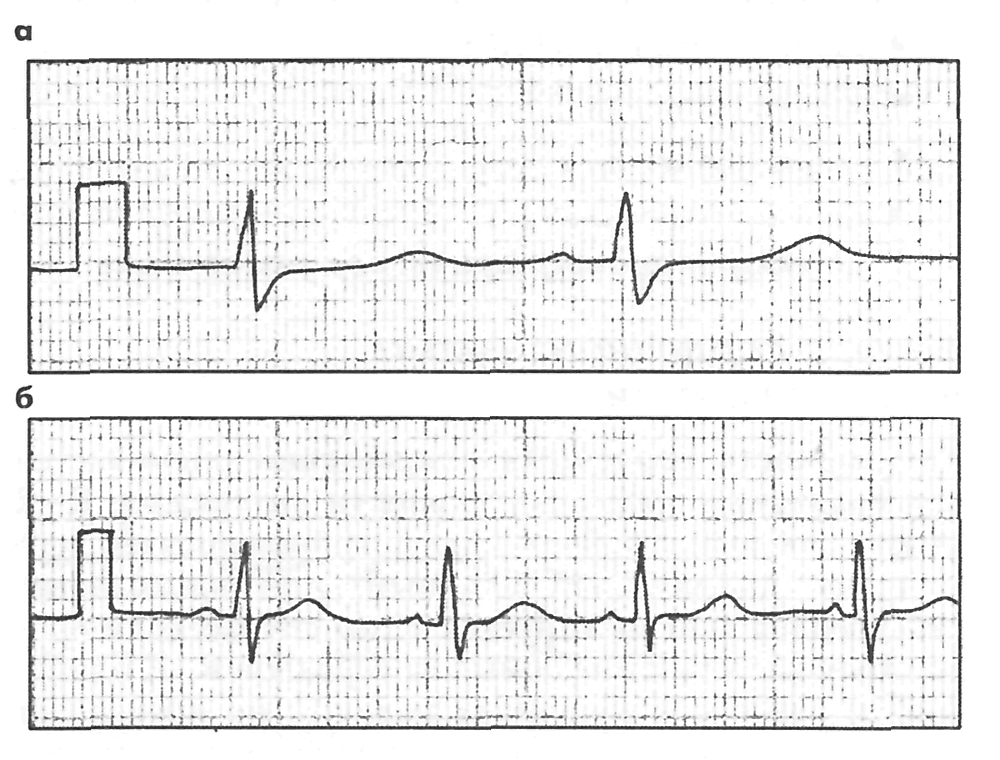
Rice. 5. The same ECG recorded at a speed of 50 mm/s and 25 mm/s.
An ECG is recorded during quiet breathing. In this case, the subject should not talk, sneeze, cough, laugh, or make sudden movements. When registering standard lead III, a deep breath with a short breath hold may be required. This is done in order to distinguish functional changes, which are often found in this lead, from pathological ones.
The section of the cardiogram with teeth corresponding to the systole and diastole of the heart is called the cardiac cycle. Typically, 4-5 cardiac cycles are recorded in each lead. In most cases this is enough. However, in case of cardiac arrhythmias or suspected myocardial infarction, recording up to 8-10 cycles may be required. To switch from one lead to another, the nurse uses a special switch.
At the end of the recording, the subject is released from the electrodes, and the tape is signed - their full name is indicated at the very beginning. and age. Sometimes, to detail the pathology or determine physical endurance, an ECG is performed against the background of medication or physical activity. Drug tests are carried out with various drugs - atropine, chimes, potassium chloride, beta-blockers. Physical activity is carried out on an exercise bike (bicycle ergometry), with walking on a treadmill, or walking at certain distances. To ensure completeness of information, an ECG is recorded before and after exercise, as well as directly during bicycle ergometry.
Many negative changes in heart function, such as rhythm disturbances, are transient and may not be detected during ECG recording even with a large number of leads. In these cases, Holter monitoring is performed - a Holter ECG is recorded in continuous mode throughout the day. A portable recorder equipped with electrodes is attached to the patient's body. Then the patient goes home, where he follows his usual routine. After 24 hours, the recording device is removed and the available data is decrypted.
A normal ECG looks something like this:
Rice. 6. ECG tape
All deviations in the cardiogram from the midline (isoline) are called waves. Teeth deviated upward from the isoline are usually considered positive, downward - negative. The space between the teeth is called a segment, and the tooth and its corresponding segment are called an interval. Before finding out what a particular wave, segment or interval represents, it is worth briefly dwelling on the principle of forming an ECG curve.
Normally, the cardiac impulse originates in the sinoatrial (sinus) node of the right atrium. Then it spreads to the atria - first the right, then the left. After this, the impulse is sent to the atrioventricular node (atrioventricular or AV junction), and then along the His bundle. The branches of the His bundle or pedicles (right, left anterior and left posterior) end in Purkinje fibers. From these fibers, the impulse propagates directly to the myocardium, leading to its contraction - systole, which is replaced by relaxation - diastole.
The passage of an impulse along a nerve fiber and the subsequent contraction of the cardiomyocyte is a complex electromechanical process, during which the values of the electrical potentials on both sides of the fiber membrane change. The difference between these potentials is called the transmembrane potential (TMP). This difference is due to the different permeability of the membrane to potassium and sodium ions. There is more potassium inside the cell, sodium - outside it. As the pulse passes, this permeability changes. In the same way, the ratio of intracellular potassium and sodium and TMP changes.
When an excitatory impulse passes, TMP increases inside the cell. In this case, the isoline shifts upward, forming the ascending part of the tooth. This process is called depolarization. Then, after the passage of the pulse, the TMP tries to take the original value. However, the permeability of the membrane to sodium and potassium does not immediately return to normal and takes some time.
This process, called repolarization, is manifested on the ECG by a downward deviation of the isoline and the formation of a negative wave. Then the polarization of the membrane takes on the initial resting value (TMP), and the ECG again takes on the character of an isoline. This corresponds to the diastole phase of the heart. It is noteworthy that the same tooth can look both positive and negative. It all depends on the projection, i.e. the lead in which it is recorded.
ECG components
ECG waves are usually designated in Latin capital letters, starting with the letter P.
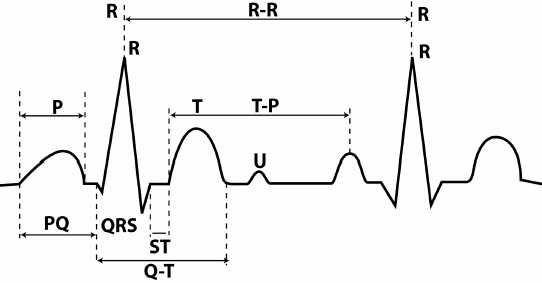
Rice. 7. ECG waves, segments and intervals.
The parameters of the teeth are direction (positive, negative, two-phase), as well as height and width. Since the height of the tooth corresponds to the change in potential, it is measured in mV. As already mentioned, a height of 1 cm on the tape corresponds to a potential deviation of 1 mV (reference millivolt). The width of a tooth, segment or interval corresponds to the duration of a phase of a particular cycle. This is a temporary value, and it is customary to denote it not in millimeters, but in milliseconds (ms).
When the tape moves at a speed of 50 mm/s, each millimeter on paper corresponds to 0.02 s, 5 mm - 0.1 ms, and 1 cm - 0.2 ms. It's very simple: if 1 cm or 10 mm (distance) is divided by 50 mm/s (speed), we get 0.2 ms (time).
Prong R. Displays the spread of excitation throughout the atria. In most leads it is positive, and its height is 0.25 mV and width is 0.1 ms. Moreover, the initial part of the wave corresponds to the passage of the impulse through the right ventricle (since it is excited earlier), and the final part - along the left. The P wave may be negative or biphasic in leads III, aVL, V 1, and V 2.
Interval P-Q (orP-R)- the distance from the beginning of the P wave to the beginning of the next wave - Q or R. This interval corresponds to the depolarization of the atria and the passage of the impulse through the AV junction, and then along the His bundle and its legs. The size of the interval depends on the heart rate (HR) - the higher it is, the shorter the interval. Normal values are in the range of 0.12 – 0.2 ms. A wide interval indicates a slowdown in atrioventricular conduction.
Complex QRS. If P represents the functioning of the atria, then the following waves, Q, R, S and T, reflect the function of the ventricles, and correspond to the various phases of depolarization and repolarization. The set of QRS waves is called the ventricular QRS complex. Normally, its width should be no more than 0.1 ms. An excess indicates a violation of intraventricular conduction.
Prong Q. Corresponds to depolarization of the interventricular septum. This tooth is always negative. Normally, the width of this wave does not exceed 0.3 ms, and its height is no more than ¼ of the next R wave in the same lead. The only exception is lead aVR, where a deep Q wave is recorded. In other leads, a deep and widened Q wave (in medical slang - kuishche) may indicate a serious heart pathology - acute myocardial infarction or scars after a heart attack. Although other reasons are possible - deviations electrical axis with hypertrophy of the heart chambers, positional changes, bundle branch block.
ProngR .Displays the spread of excitation throughout the myocardium of both ventricles. This wave is positive, and its height does not exceed 20 mm in the limb leads, and 25 mm in the chest leads. The height of the R wave is not the same in different leads. Normally, it is greatest in lead II. In ore leads V 1 and V 2 it is low (because of this it is often denoted by the letter r), then it increases in V 3 and V 4, and in V 5 and V 6 it decreases again. In the absence of the R wave, the complex takes on the appearance of QS, which may indicate transmural or cicatricial myocardial infarction.
Prong S. Displays the passage of the impulse through the lower (basal) part of the ventricles and the interventricular septum. This is a negative tooth and its depth varies widely, but should not exceed 25 mm. In some leads the S wave may be absent.
T wave. The final section of the ECG complex, displaying the phase of rapid ventricular repolarization. In most leads this wave is positive, but it can also be negative in V1, V2, aVF. The height of the positive waves directly depends on the height of the R wave in the same lead - the higher the R, the higher the T. The causes of a negative T wave are varied - small focal myocardial infarction, dishormonal disorders, previous meals, changes in the electrolyte composition of the blood, and much more. The width of the T waves usually does not exceed 0.25 ms.
Segment S-T– the distance from the end of the ventricular QRS complex to the beginning of the T wave, corresponding to complete coverage of the ventricles by excitation. Normally, this segment is located on the isoline or deviates from it slightly - no more than 1-2 mm. Large S-T deviations indicate a severe pathology - a violation of the blood supply (ischemia) of the myocardium, which can lead to a heart attack. Other, less serious reasons are also possible - early diastolic depolarization, a purely functional and reversible disorder mainly in young men under 40 years of age.
Interval Q-T– the distance from the beginning of the Q wave to the T wave. Corresponds to ventricular systole. Magnitude interval depends on heart rate - the faster the heart beats, the shorter the interval.
ProngU . An unstable positive wave, which is recorded after the T wave after 0.02-0.04 s. The origin of this tooth is not fully understood, and it has no diagnostic value.
ECG interpretation
Heart rhythm . Depending on the source of generation of impulses of the conduction system, sinus rhythm, rhythm from the AV junction, and idioventricular rhythm are distinguished. Of these three options, only sinus rhythm is normal, physiological, and the other two options indicate serious disturbances in the conduction system of the heart.
Distinctive feature sinus rhythm is the presence of atrial P waves - after all, the sinus node is located in the right atrium. With a rhythm from the AV junction, the P wave will overlap the QRS complex (while it is not visible, or follow it. With an idioventricular rhythm, the source of the pacemaker is in the ventricles. In this case, widened deformed QRS complexes are recorded on the ECG.
Heart rate. It is calculated by the size of the gaps between the R waves of neighboring complexes. Each complex corresponds to a heartbeat. It is not difficult to calculate your heart rate. You need to divide 60 by the R-R interval, expressed in seconds. For example, the R-R gap is 50 mm or 5 cm. At a belt speed of 50 m/s, it is equal to 1 s. Divide 60 by 1 to get 60 heart beats per minute.
Normally, heart rate is in the range of 60-80 beats/min. Exceeding this indicator indicates an increase in heart rate - tachycardia, and a decrease - a decrease in heart rate, bradycardia. At normal rhythm R-R spaces on the ECG should be the same, or approximately the same. A small difference in R-R values is allowed, but not more than 0.4 ms, i.e. 2 cm. This difference is typical for respiratory arrhythmia. This is a physiological phenomenon that is often observed in young people. With respiratory arrhythmia, there is a slight decrease in heart rate at the height of inspiration.
Alpha angle. This angle displays the total electrical axis of the heart (EOS) - the general direction vector of electrical potentials in each fiber of the conduction system of the heart. In most cases, the directions of the electrical and anatomical axis of the heart coincide. The alpha angle is determined using the six-axis Bailey coordinate system, where standard and unipolar limb leads are used as axes.

Rice. 8. Six-axis coordinate system according to Bailey.
The alpha angle is determined between the axis of the first lead and the axis where the largest R wave is recorded. Normally, this angle ranges from 0 to 90 0. In this case, the normal position of the EOS is from 30 0 to 69 0, the vertical position is from 70 0 to 90 0, and the horizontal position is from 0 to 29 0. An angle of 91 or more indicates a deviation of the EOS to the right, and negative values of this angle indicate a deviation of the EOS to the left.
In most cases, a six-axis coordinate system is not used to determine EOS, but is done approximately by the value of R in standard leads. In the normal position of the EOS, the height of R is greatest in lead II and smallest in lead III.
Using an ECG, various disorders of the rhythm and conduction of the heart, hypertrophy of the heart chambers (mainly the left ventricle), and much more are diagnosed. ECG plays a key role in diagnosing myocardial infarction. Using a cardiogram, you can easily determine the duration and extent of a heart attack. Localization is judged by the leads in which pathological changes are detected:
I – anterior wall of the left ventricle;
II, aVL, V 5, V 6 – anterolateral, lateral walls of the left ventricle;
V 1 -V 3 – interventricular septum;
V 4 – apex of the heart;
III, aVF – posterodiaphragmatic wall of the left ventricle.
ECG is also used to diagnose cardiac arrest and evaluate the effectiveness of resuscitation measures. When the heart stops, all electrical activity stops, and a solid isoline is visible on the cardiogram. If resuscitation measures (indirect cardiac massage, administration of drugs) are successful, the ECG again displays waves corresponding to the work of the atria and ventricles.
And if the patient looks and smiles, and the ECG shows an isoline, then two options are possible - either errors in the ECG recording technique, or a malfunction of the device. The ECG is recorded by a nurse, and the data obtained is interpreted by a cardiologist or doctor. functional diagnostics. Although a doctor of any specialty is required to navigate issues of ECG diagnostics.
Allows you to monitor the condition of your heart and monitor the ECG. Monitor the signs of a normal ECG. You do a study and after 30 seconds you receive an automatic conclusion about the condition of your heart. If necessary, you can send the study for medical supervision.
The device can be purchased right now for 20,400 rubles with delivery throughout Russia by clicking the Buy button.
ECG is the main method for diagnosing heart rhythm disorders. This publication briefly presents signs of a normal ECG. The ECG recording is carried out in a position comfortable for the patient, breathing should be calm. To record an ECG, 12 main leads are most often used: 6 from the limbs and 6 from the chest. The project offers an analysis of microalternations in six leads (only electrodes placed on the limbs are used), which allow one to independently identify possible abnormalities in the functioning of the heart. Using the project, analysis of 12 leads is also possible. But at home, it is difficult for an untrained person to correctly position the chest electrodes, which can lead to incorrect recording of the electrocardiogram. Therefore, the CARDIOVISOR device, which records 12 leads, is purchased by cardiologists.
To obtain 6 standard leads, electrodes are applied as follows:
. Lead I: left hand (+) and right hand (-)
. Lead II: left leg (+) and right arm (-)
. III lead: left leg (+) and left arm (-)
. aVR - enhanced abduction from the right hand (short for augmented voltage right - enhanced potential on the right).
. aVL - enhanced abduction from the left arm
. aVF - increased abduction from the left leg
The figure shows an electrocardiogram obtained by a client in a website project

Each lead characterizes the work of a specific area of the myocardium. Leads I and aVL reflect the potentials of the anterior and lateral walls of the left ventricle. Leads III and aVF reflect the potentials of the inferior phrenic (posterior) wall of the left ventricle. Lead II is intermediate and confirms changes in the anterolateral or posterior wall of the left ventricle.
The heart consists of two atria and two ventricles. The mass of the atria is much smaller than the mass of the ventricles, so the electrical changes associated with atrial contraction are small. They are associated with the P wave. In turn, when the ventricles are depolarized, high-amplitude fluctuations are recorded on the ECG - this is the QRS complex. The T wave is associated with the return of the ventricles to a state of rest.

When analyzing an ECG, a strict sequence is followed:
. Heart rhythm
. Intervals reflecting conductivity
. Electrical axis of the heart
. Description of QRS complexes
. Description of ST segments and T waves
Heart rhythm and heart rate
Heart rhythm is an important indicator of heart function. Normally, the rhythm is sinus (the name is associated with the sinus node - the pacemaker, thanks to whose work the impulse is transmitted and the heart contracts). If depolarization does not begin in the sinus node, then in this case they speak of arrhythmia and the rhythm is named after the department from which depolarization begins. Heart rate (HR) is determined on the ECG by the distance between the R waves. The heart rhythm is considered normal if the duration of the R-R intervals is the same or has a slight variation (up to 10%). Normal heart rate is 60-80 beats per minute. The ECG machine advances the paper at a speed of 25mm/s, so a large square (5mm) corresponds to 0.2 seconds (s) or 200 milliseconds (ms). Heart rate is measured using the formula
Heart rate = 60/R-R,
where R-R is the distance between the highest teeth associated with ventricular contraction.

The acceleration of the rhythm is called tachycardia, and the slowdown is called bradycardia.
An ECG analysis should be performed by a cardiologist. Using CARDIOVISOR, the client of the project can take an ECG independently, since all calculations are carried out by a computer program, and the patient sees the final result analyzed by the system.
Intervals reflecting conductivity
By the intervals between the P-QRS-T waves, one can judge the conductivity of the electrical impulse between the parts of the heart. Normally, the PQ interval is 120-200 ms (3-5 small squares). The PQ interval can be used to judge the conduction of an impulse from the atria through the atrioventricular (atrioventricular) node to the ventricles. The QRS complex characterizes the excitation of the ventricles. The width of the QRS complex is measured from the beginning of the Q wave to the end of the S wave. Normally, this width is 60-100 ms. They also look at the nature of the teeth of this complex. Normally, the Q wave should be no more than 0.04 s in duration and not exceed 3 mm in depth. An abnormal Q wave may indicate myocardial infarction.

QT interval characterizes total duration systole (contraction) of the ventricles. The QT includes the interval from the beginning of the QRS complex to the end of the T wave. Bazett's formula is often used to calculate the QT interval. This formula takes into account the dependence of the QT interval on the rhythm frequency (QTc). Normally, the QTc interval is 390-450 ms. Prolongation of the QT interval indicates the development of coronary heart disease, atherosclerosis, rheumatism or myocarditis. A shortened QT interval may indicate hypercalcemia.
All intervals reflecting the conductivity of the electrical impulse are calculated by a special program, which allows you to obtain fairly accurate examination results, which are visible in the system diagnostic cabinet mode.
Electrical axis of the heart (EOS)
Determining the position of the electrical axis of the heart makes it possible to identify areas of disturbance in the conduction of the electrical impulse. The position of the EOS is assessed by cardiologists. When using, data on the position of the electrical axis of the heart is calculated automatically and the patient can view the result in his diagnostic room. To determine the EOS, look at the height of the teeth. Normally, the R wave should be larger than the S wave (counted from the isoline) in leads I, II and III. Deviation of the axis to the right (the S wave is larger than the R wave in lead I) indicates problems in the functioning of the right ventricle, and deviations to the left (the S wave is larger than the R wave in leads II and III) may indicate left ventricular hypertrophy.
Description of the QRS complex
The QRS complex arises due to the conduction of an impulse through the septum and myocardium of the ventricles and characterizes their work. Normally, there is no pathological Q wave (no wider than 20-40 ms and no deeper than 1/3 of the R wave). In lead aVR, the P wave is negative, and the QRS complex is oriented downward from the isoelectric line. The width of the QRS complex normally does not exceed 120 ms. An increase in this interval may indicate bundle branch block (conduction disorder).

Drawing. Negative P wave in lead aVR (isoelectric line indicated in red).
P wave morphology
The P wave reflects the propagation of the electrical impulse through both atria. The initial part of the P wave characterizes the activity of the right atrium, and the final part - the left atrium. Normally, the P wave should be positive in leads I and II, aVR - negative, usually positive in aVF and inconsistent in leads III and aVL (can be positive, inverted or biphasic). The normal width of the P wave is at least 0.12 s (120 ms). With an increase in the width of the P wave, as well as its doubling, we can talk about a violation of the impulse conduction - atrioventricular block occurs (figure).
Drawing. Doubling and increasing the width of the P wave

Description of ST segments and T waves
ST segment corresponds to the period when both ventricles are completely covered by excitation, measured from the end of the S wave to the beginning of the T wave. The duration of ST depends on the pulse rate. Normally, the ST segment is located on an isoline, ST depression is allowed up to 0.5 mm, its elevation in standard leads should not exceed 1 mm. ST segment elevation is observed in acute infarction and pericarditis, and depression indicates myocardial ischemia or the influence of cardiac glycosides.
T wave characterizes the process of repolarization (return of the ventricles to their original state). During normal heart function, the T-wave is directed upward in leads I and II, but in lead aVR it will always be negative. A tall and pointed T wave is observed with hyperkalemia, while a flat and elongated wave indicates the opposite process - hypokalemia. A negative T wave in leads I and II may indicate ischemia, infarction, hypertrophy of the right and left ventricles, or pulmonary embolism.
The main parameters that are used to analyze the ECG using the standard method are described above. The project offers ECG analysis, which is based on the dispersion mapping method. It is based on the formation of an information-topological model of small ECG oscillations - microalterations of the ECG signal. Analysis of these deviations makes it possible to identify pathology in the work of the heart at earlier stages, in contrast to standard method ECG analysis.
Rostislav Zhadeiko, especially for the project.


